
Synthetic Yield on Bitcoin: Implementation, Discipline, and Performance Boundaries of Systematic Covered Call Writing

Executive Summary
Covered call writing (selling) on Bitcoin has attracted growing institutional interest as a strategy to generate synthetic yield for existing BTC holders. To the best of our knowledge, this paper provides the most comprehensive systematic analysis of this strategy to date, combining hourly-frequency simulation across the full Deribit implied volatility surface with more than 37,000 individual backtests spanning every possible entry point over the 4.5 years period ended on April 30, 2026.
The motivation is straightforward. Bitcoin options have transformed in recent years from a niche corner of crypto derivatives into a deep, institutionally-relevant market. Notional open interest has grown roughly ten-fold over the past four years, now sitting above the open interest of the entire BTC futures market. IBIT options, launched in late 2024, have grown explosively and now rival Deribit as the leading venue. The market that institutional allocators are evaluating today is broader, deeper, and considerably more accessible to traditional capital pools than the market that existed even eighteen months ago.
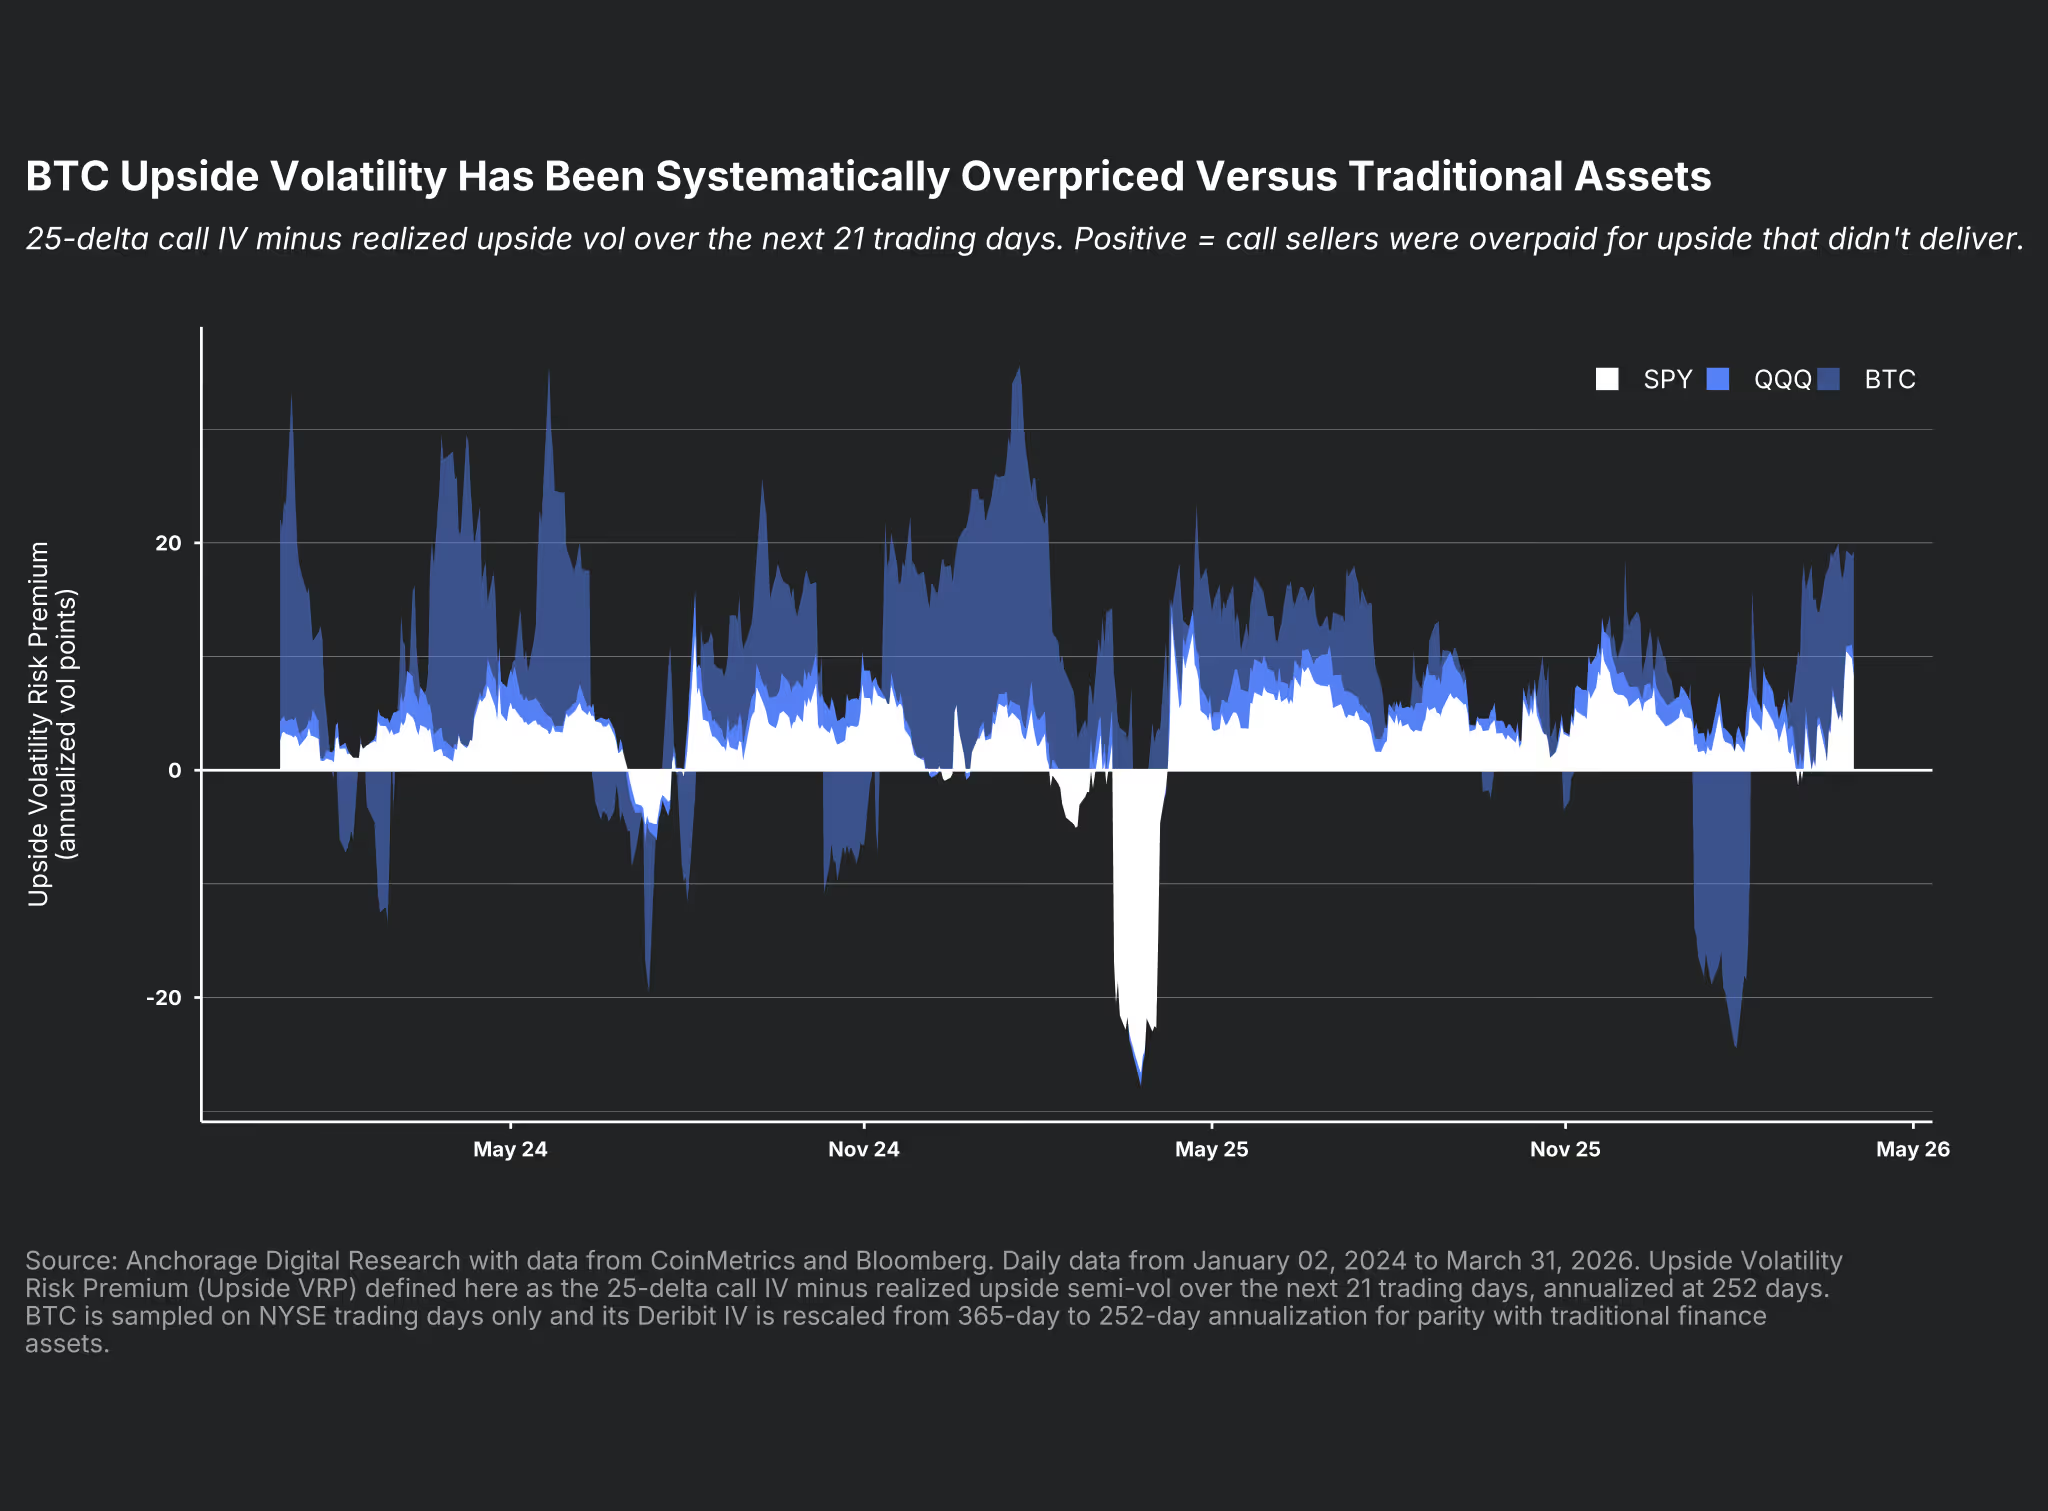
More importantly, the empirical case for harvesting BTC's volatility risk premium has held throughout this transformation. The chart below compares 25-delta call implied volatility minus realized upside volatility over the subsequent 21 trading days, computed on a like-for-like basis for BTC, SPY, and QQQ. BTC's upside volatility risk premium has averaged roughly two to three times what SPY and QQQ deliver, with the gap persistent for most of the post-2024 window.
This is the empirical anchor for why systematic BTC volatility selling has attracted institutional attention: the premium is real, it is persistent, and it is structurally larger than in traditional asset classes.
The central finding of the paper is that systematic covered call writing on BTC has been able to generate reliable, positive yield across a wide range of market environments, but only when implemented with the discipline that the strategy's risk profile demands. The distinction between disciplined and undisciplined implementation is not a matter of degree. It is the difference between a strategy that consistently adds value and one that reliably destroys it.
The foundational tension. A simple unfiltered strategy selling 20-delta, 30-day calls generated a net yield of 5.5% over the most recent twelve months of the study period, materially cushioning BTC's −19.4% spot decline. However, when extended to the full study period from October 2021 to April 2026, the same strategy produced a negative net yield even if most trades are profitable. The apparent paradox of many winning trades with no net yield is the key to understanding covered call writing on BTC. The strategy is what derivatives traders call picking up pennies in front of a steamroller: many small premiums collected in benign environments, periodically given back in the few moments when the market runs them over. BTC's episodic, parabolic bull markets are precisely the moments that matter most, and an undisciplined seller is overrun by them.
The role of discipline. Applying a simple set of regime and implied volatility filters, such as requiring that BTC's trend not be strongly bullish and that implied volatility be elevated relative to its recent average before entering any new position, reverses the full-period outcome entirely. The filtered strategy generated a net yield of 23.7% over the full period (+5.2% annualized), improved the blended portfolio Sharpe from 0.20 to 0.30, and did so while being in the market only 44% of the time from October 2021 to April 2026.
The productive parameter corridor. Expanding the analysis to a systematic grid of 108 parameter combinations across delta (5 to 45), expiry (7 to 90 days), and regime filter status identifies the structural boundaries of the opportunity. Delta is the single most consequential choice. Below 10-delta, yields are consistent but too thin for most institutional mandates. Above 25-delta, directional exposure overwhelms the strategy through BTC's bull markets even with the regime filter active. Short-dated structures of 7 and 14 days tend to be structurally disadvantaged on BTC because their premium is too thin to absorb the stop-loss events that BTC's intraday volatility generates. The productive region has historically ranged between 10-delta and 25-delta, paired with expiries of 21 days or longer.
Robustness across entry points and the patience premium. A rolling window analysis tests every configuration in this productive corridor across every possible 1-year and 3-year starting point in the dataset. The results quantify what we call the patience premium in BTC covered call selling. At the 1-year horizon, positive yield rates across the productive corridor range from roughly 55% to 85%, which are good win rates but somewhat reflect regime sensitivity rather than structural yield. At the 3-year horizon, eleven of twelve configurations produce positive yield in 91% or more of all rolling windows, with five reaching 100%. Median annualized yields at the 3-year horizon cluster between 4% and 6% across the productive corridor, with the worst-decile outcome remaining positive for every configuration except for one. An investor with a 3-year mandate is running a yield strategy with a historically consistent probability of success.
Three investor profiles. The data supports three distinct implementation profiles corresponding to different institutional objectives. A consistency-oriented mandate is best served by lower deltas in the 10–15 range paired with shorter-to-mid expiries of 30–60 days, the corner of the parameter space where every tested configuration produced positive yield in the worst decile of 3-year windows and at least 93% of windows overall. A balanced yield mandate is best served by mid-range deltas of 15–20 paired with 30-day expiries, which combines near-universal positive 3-year outcomes with median yields meaningfully above the conservative corner and aligns with the most liquid point on the Deribit volatility surface. A yield-maximization mandate is best served by higher deltas in the 20–25 range paired with longer expiries of 60–90 days, where median 3-year yields reach the high end of the entire grid at the cost of wider single-window dispersion. Across all three profiles, two conditions hold without exception: some form of market regime filter must be active and the implementation horizon must be measured in years rather than months.
The framework as a floor. The filters and implementation choices examined here are the simplest possible expressions of a systematic covered call strategy and therefore represent more a performance floor than a ceiling. For example, the strategy as tested sells the same delta in every regime and treats the volatility surface as a single number when in practice the shape of the surface and the intensity of the market regime carry their own information. Institutional volatility overlay managers with access to term structure dynamics, skew signals, market flow data, real-time positioning analysis, and active position sizing have the tools to improve on every metric reported here.
Capturing the volatility risk premium reliably to generate synthetic yield on Bitcoin is fundamentally an active management problem, where strategy design and risk discipline are central. The parameter corridor and results identified in this paper can help institutional investors to find where to fish, but ultimately the quality of their regime identification, execution infrastructure, and risk discipline determines how much they catch.
Why Now: The Rise of Bitcoin Options and the Structural Case for Covered Call Selling
Bitcoin options have exploded from a niche corner of crypto derivatives into a deep, institutionally-relevant market.
The notional open interest (OI) in BTC options has grown roughly ten-fold over the past five years, breaking above $100 billion briefly at the end of 2025 to sit at around $60 billion currently. For context, this is above the open interest of the whole BTC futures market (including both perpetual and dated contracts), which currently stands at under $50 billion and peaked at $60 billion.
The top panel of the chart shows the evolution of open interest in Deribit and IBIT, which are the two growth engines of the BTC options market.
Deribit, the spot-margined venue that has historically anchored BTC options price discovery, has been growing steadily as crypto-native institutional flow has matured. Since November 2024, however, IBIT options have grown explosively and now rival or even surpass Deribit as the leading venue for BTC options OI and trading activity. As a result, the market that institutional allocators are evaluating today is not the same market that existed even eighteen months ago. It is broader, deeper, and considerably more accessible to traditional capital pools.

The bottom panel of the previous chart also reveals another notable trend: the share of calls in open interest has declined over time, falling from nearly 70% two years ago to just under 60% today. This points to a more two-sided market, with hedging and structured product flows growing in importance relative to simpler leverage and upside-capture strategies.
Even so, the BTC options market remains exceptionally call-heavy by traditional standards. SPY and QQQ, for instance, held just 34% and 36% of their open interest in calls as of April 2026. This means that BTC's 60% call share, while down from its highs, still sits roughly 25 percentage points above mature equity index options markets.
As a result the absolute level of implied volatility relative to subsequent realized upside volatility has remained substantial. In simpler terms, the price at which options are being sold continues to exceed the size of the actual upside moves that follow by a wider margin in BTC than in more traditional assets.
The next chart compares 30-day, 25-delta call implied volatility against the realized upside volatility that followed over the next 21 trading days, computed on a like-for-like basis for BTC, SPY, and QQQ.

The chart above is the empirical anchor for why there is so much interest in BTC volatility selling: BTC's upside volatility risk premium has averaged roughly two to three times what SPY and QQQ deliver, and this gap has been persistent for most of the time over the past couple of years.
Both SPY and QQQ hover in a narrow band of low single-digit positive premiums punctuated by one sharp, negative excursion from the Liberation Day stock market crash in early 2025. The BTC premium sits structurally above them, occasionally reaching 20 or 30 vol points of forward-looking premium, with its own tail events that go meaningfully negative when realized upside surprises (January 2026 being the most prominent example in the sample but far from the only one).
This pattern is consistent with what the academic literature on the volatility risk premium predicts: implied volatility tends to exceed realized volatility because option buyers pay a premium for tail protection and convexity, and BTC's structurally higher demand for upside exposure can make that premium more substantial than in traditional assets.
That is the opportunity, and covered call writing (also called covered call selling) is the most straightforward way to capture it.
A covered call combines a long position in the underlying asset (in this case, BTC) with a short call option. In exchange, the seller collects an upfront premium. If the underlying stays below the strike at expiry, the premium is kept in full and the seller participates in the upside up to the strike. If the underlying rallies through the strike and the option is kept until maturity, the upside is capped and the seller forgoes the gains beyond it. In return for that cap, the seller's breakeven on the combined position sits below the entry spot by the amount of premium collected, providing a modest cushion against downside moves.

In practice, systematic implementations rarely hold positions to expiry. Active management of entries and exits is central to capturing the premium reliably, as we examine in the simulations that follow.
The remainder of this report asks a deceptively simple question. Can a systematic call selling overlay on BTC generate reliable yield across different market environments, and if so, under what conditions?
We begin with a simple recent simulation where a simple covered call overlay would have fully offset BTC's spot losses. From there we test the strategy against a broader BTC market cycle, across a broad parameter space of different deltas and expiries, and finally across every possible entry point covered in our study period.
Systematic Covered Call Writing on Bitcoin: Isolating the Conditions for Premium Capture
The Recent Case: Why Covered Call Selling Is Having a Moment
To understand why covered call writing on Bitcoin has attracted institutional attention more recently, we start with a simulation covering the most recent twelve months of our October 01, 2021 to April 30, 2026 study period.
But before proceeding, a brief word on methodology.
All simulations in this paper are built on Deribit implied volatility surface data, with option premiums computed using the Black-76 model and entry strikes solved analytically from the target delta. Execution is modeled with one volatility point of symmetric slippage on both legs to avoid the common backtesting error of assuming mid-market fills. Entries, exits, mark-to-market valuations, and stop-loss checks run at hourly granularity, while performance metrics are computed on daily-aggregated returns to remain comparable to standard institutional reporting.
Returns are expressed on initial capital so that the covered call yield is directly additive to the underlying BTC spot return. Appendix I provides the full methodological detail, including filter construction, data sources, and the assumptions behind each key design choice.
From April 30, 2025 through April 30, 2026, a simple and conservative systematic BTC covered call strategy selling 20-delta, 30-day calls generated a net yield of 5.5% on the underlying spot BTC position, with a Sharpe ratio on the overlay itself of 0.53. During this same period, the BTC spot return was a negative 19.4%. In other words, this strategy would have offset almost a third of the BTC price drop over the period.

The mechanics of why this worked deserve a brief explanation.
The strategy sells a call option with a delta of approximately 20 at the moment of sale. In other words, the selected option instrument assigns roughly a 20% risk-neutral probability to the option expiring in the money. But because the BTC implied volatility has historically run above subsequent realized volatility, the true statistical probability of expiring in the money has tended to run somewhat lower.
In exchange for accepting a cap on upside participation above that strike, the strategy collected an upfront premium. If BTC stayed below the strike at expiry, the option expired worthless and the full premium was kept. If BTC moved toward or through the strike, the net premium collected is reduced by whatever intrinsic value the option carried at settlement.
This dynamic explains the pattern visible in the chart above.
During the first half of the period, when BTC rallied from May through October 2025, the overlay lagged spot modestly, as collected premiums were partially offset by buyback costs on positions where BTC moved toward or through the strike. This is the expected and acceptable cost of the strategy: Upside participation is capped, and in rising markets that cap is felt.
The divergence accelerated in the second half, when BTC reversed sharply from its October peak and fell through early 2026. In that environment the dynamics inverted entirely, as the overlay's collected premiums required no buybacks as options expired worthless, and the accumulated income built a growing cushion above the spot return. By April 2026, the lift provided by the covered call net yield came entirely from this premium collection in a market that ultimately moved in the option seller’s favor.
The following table summarizes the strategy's key performance metrics across the spot position, the spot position overlaid with the covered call selling, and the impact provided by the options strategy.

Across 16 trades, 13 saw the call decay essentially to worthlessness and 3 were overrun by sharp upside moves through the strike, a win/loss ratio of 4.33 to 1. The 16th trade was still open when the simulation window ended on April 30, 2026, and was closed at its mark-to-market value on that final bar. This forced settlement is a backtest accounting mechanic that ensures all positions are marked to a realized cash value for performance computation, not a discretionary exit signal.
Covered call overlays are known to smooth the daily return distribution, and this period was no exception. The blended Sharpe improved from −0.47 to −0.39, driven by both the return contribution from premium and the volatility reduction from 40.6% to 35.0%.
Importantly, the strategy only modestly reduced the maximum drawdown, from 49.7% to 44.5%, which is the expected result for a yield enhancement tool. Covered call writing is not a hedging strategy: It is not intended to significantly insulate the portfolio from heavy drawdown in the underlying. What it does is generate income that partially offsets those moves, and the 5.1 percentage point drawdown improvement seen here reflects exactly that mechanism at work.
The Full Period: Why It Is Never That Simple
Extending the same simple strategy to the full period covered in this report (between October 2021 and April 2026) reveals a considerably more challenging picture and illustrates the central risk of covered call writing that practitioners and academics have long identified.
The same strategy that generated 5.5% yield over the last twelve months produced a negative yield of 0.5% (or -0.1% annualized) if deployed over our whole study period. The profit factor of 1.00, meaning that for every dollar of premium collected $1.00 was paid back in buybacks, confirms that the strategy performed marginally below breakeven on the option overlay across the full cycle despite a favorable win/loss ratio of 4.38 to 1. Roughly four winning trades for every losing trade, and yet the strategy lost money overall. That apparent paradox is the key to understanding covered call selling.

That apparent paradox is the central feature, not a bug, of covered call writing. The strategy is what derivatives traders call picking up pennies in front of a steamroller, when many small premiums collected in benign environments are periodically given back in the few moments when the market runs them over.
The explanation lies in the asymmetry of outcomes. Over the full period, BTC experienced several violent and sustained bull runs, including the late 2021 cycle peak, the 2023–2024 recovery rally that took prices from roughly $16,000 to over $70,000, and the 2025 bull market that briefly pushed BTC above $100,000. In those environments, short call positions sold were repeatedly and aggressively overrun by spot prices moving through the strike. The strategy recorded 13 negative outcomes across 70 total trades.
In other words, this result is a textbook illustration of short volatility risk.
The covered call strategy has a return profile that resembles insurance writing. It collects many small premiums and periodically pays out a larger claim. The strategy's expected value is positive when implied volatility is consistently richer than realized volatility, which is often the case. But the IV/RV spread is only half the story.
The second factor is autocorrelation: when realized moves are serially correlated rather than independent, large moves cluster in time, and a short call seller faces the same trending market across multiple consecutive expiry cycles rather than a single shock that mean-reverts. BTC's tendency toward episodic, parabolic bull markets is precisely this kind of autocorrelated regime. Realized upside volatility dramatically exceeds what was implied at the moment of option sale, and because the trend persists, each new short position is opened into a market that has already moved against the previous one. In those moments, the strategy's short volatility exposure, which is normally a source of steady income, becomes a source of relatively large and concentrated losses.
The following table summarizes the simulation’s key performance metrics across the spot position, the spot position overlaid with the covered call selling, and the impact provided by the options strategy.

From a portfolio perspective, the blended portfolio still shows a marginally improved Sharpe ratio compared to holding spot alone: 0.25 versus 0.20. This is because the 57 winning trades, even though their aggregate dollar value was slightly negative, reduced the daily volatility of the portfolio enough to slightly improve the ratio of return to risk. But a yield strategy that subtracts from total return is a hard sell even if it improves the Sharpe ratio.
It is worth being precise about what this result does and does not mean.
It does not mean the strategy is fundamentally flawed or that the volatility risk premium does not exist in BTC options markets. The VRP is real and broadly persistent, as previously established. However, harvesting the VRP in an undisciplined, always-on manner, or selling calls regardless of the market environment, is far from optimal. The premium collected in favorable regimes is significant but not large enough to absorb the losses that accumulate when the strategy is run through BTC's most violent bull markets without any mechanism to reduce exposure or avoid entry in the first place.
That is why covered call selling is fundamentally an active management strategy, not a passive income overlay. Profitably capturing this premium requires the discipline to distinguish between market environments where the volatility risk premium is genuinely on offer and those where it is not.
The Role of Market Regime Filters in Harvesting the Volatility Risk Premium
Regime identification is a critical job of the successful volatility overlay manager. Premium collection, given a reliable volatility surface and reasonable execution, is largely mechanical. Regime identification is where much of the intellectual edge lives.
This section will shed light on this question by applying a few simple market regime and volatility filters.
These filters are intentionally kept simple because they are designed for transparency and replicability rather than optimality. In practice, institutional volatility overlay managers employ considerably more sophisticated regime identification frameworks, incorporating term structure dynamics, skew analysis, options market flow data, and others.
The results presented here should therefore be interpreted as a conservative lower bound, or maybe a performance benchmark, on what disciplined active management of a covered call overlay can achieve. The paper's contribution is not to prescribe a specific filter set, but to demonstrate that the distinction between disciplined and undisciplined implementation is an important determinant of whether the volatility risk premium is consistently captured or destroyed.
The filters used in these simulations operate on two dimensions: entry discipline and exit discipline.
On the entry side, two filters must both be satisfied before a new position is opened. The first is a market regime filter: the strategy only sells calls when BTC's price trend, as measured by a three-level simple moving average stack (10-day, 30-day, and 50-day), is not anticipating a major bull run. When the shorter-term average sits above the medium-term average, which sits above the longer-term average (a classic bull trend signal) the strategy waits. The second entry filter requires that the current 30-day implied volatility for the relevant delta be above its 90-day rolling average (the IV richness condition). The strategy only sells when implied volatility is elevated relative to recent history, maximizing the probability that the premium on offer reflects genuine overpricing of risk rather than fair compensation for expected moves.
On the exit side, the filtered strategy employs three rules working in concert. A take-profit threshold closes the position when the option has decayed by a certain percentage (in this case 75%) of its entry value, locking in the majority of the premium without waiting for full expiry and the associated additional risk. A delta stop-loss exits the position if the live delta rises above a certain level (for example, 0.45), enforcing a hard limit on how directional the short call exposure is allowed to become before the trade is abandoned. And a two-day minimum DTE buffer closes any position still open within 48 hours of expiry, avoiding the period of maximum gamma risk when even small spot moves can cause large option value changes.
The results of applying this simple framework in this example are materially better than the unfiltered previous simulation by and large across every meaningful dimension.

The covered call contribution turns to a positive 23.7% over the full period (5.2% annualized), reversing the -0.5% over the full period (-0.1% annualized) from the unfiltered case. This improvement represents the quantifiable value of disciplined risk management. The blended portfolio Sharpe rises from 0.20 to 0.30 and the Sortino ratio rises from 0.27 to 0.39.
The cost of this improvement is selectivity. The regime filter allowed the strategy to run only 44% of the time. In absolute terms it also recorded more stop-loss exits than the unfiltered strategy (19 vs 13), which reflect the exit filters in action. The win/loss ratio declined from 4.38:1 to 2.47:1, which reflects a more balanced and ultimately more honest return distribution: fewer easy wins from decaying calls in favorable conditions, but also fewer catastrophic losses from being caught on the wrong side of a major trend.

These three simulations together show the opportunities and challenges embedded in covered call selling strategies.
It can generate real and persistent yield in the right conditions, but run naively across all market environments it fails to capture that yield reliably over a full cycle. Run with disciplined entry and exit rules it can deliver consistent positive yield, an improved risk-adjusted return profile, and a more robust performance distribution across different market regimes.
Delta and Expiry: The Two Parameters That Define BTC Covered Call Strategy Results
The logical next question is which implementation choices across delta and expiry produce the most consistent outcomes given BTC's specific risk and return characteristics.
The preceding simulations used a single implementation: a 20-delta, 30-day call chosen for its institutional familiarity. Whether this specific combination represents an optimal configuration, or even a particularly good one, is the question this section addresses.
To start answering this, we run a systematic grid of 108 parameter combinations across delta (5 to 45), expiry (7, 14, 21, 30, 60, and 90 days), and regime filter status (on or off) evaluated over the full study period from October 2021 through April 2026.
Delta: The Single Most Consequential Choice
Delta selection has the largest impact on both the level and the consistency of strategy outcomes. On top of that, the relationship between delta and performance is nonlinear. It effectively divides the parameter space into three meaningfully distinct regions.
The boxplot below shows the full distribution of annualized covered call yield outcomes at a given delta level, aggregated across all other combinations of expiry over the entire analysis period. The horizontal line inside each box represents the median outcome, the box boundaries mark the 25th and 75th percentiles, the whiskers extend to the most extreme non-outlier observations, and individual dots represent outlier combinations that fall beyond the outlier range.
Reading the chart vertically for any given delta therefore answers the question: if an investor commits to this delta level but varies everything else within the tested ranges, what is the distribution of annualized yields they could have experienced for the full period under consideration?

At the conservative end of the range, 5-delta and 10-delta configurations generate the most consistently positive outcomes across the entire grid. Win/loss ratios are extremely high and directional exposure is negligible. In these configurations, the short call position is so far out of the money that BTC's price moves have a limited impact on the option's value, and the premium simply decays over the holding period. The limitation is that the generated annualized yields are somewhat capped, barely surpassing 5% in any simulated scenario.
On the other end of the spectrum, the results at the aggressive end (30-delta and 35-delta) show high risk of negative outcomes. The regime filter can provide a substantial absolute improvement, but cannot overcome the fundamental problem: At these delta levels, the short call position takes on meaningful directional exposure at entry, and BTC's bull runs repeatedly and severely overrun positions before they can be exited profitably. These levels are simply too directionally exposed to be consistently viable as a systematic yield strategy and would require a much better market regime filter to consistently perform well.
Another productive region has been the one between 15-delta and 25-delta. This is where the regime filter reliably transforms marginal or negative unfiltered outcomes into solidly positive ones. Although their average results do not look materially better than the ones in the conservative bucket for this simulation, we’ll see further down that it can be the region that achieves the highest net yields while still limiting negative outcomes.

Expiry: The Counterintuitive Case for Longer Tenors
Conventional wisdom in options income strategies strongly favors short-dated options, typically weekly or two-week structures, on the grounds that theta decay accelerates in the final days before expiry. This makes the theta-to-vega ratio most favorable at short tenors, allowing frequent rolling to systematically harvest that accelerating decay.
This dynamic, however, is most reliable in low-volatility environments, where gamma risk remains contained. For an asset like BTC, where realized volatility routinely exceeds 60% and gap moves overnight can dwarf any premium collected, the short-dated approach introduces meaningful gamma exposure that can turn a yield-harvesting strategy into an unintended directional bet.
The next chart replicates the previous one but replaces delta for expiries. This time the question we are trying to answer is: If an investor commits to this expiry level but varies everything else within the tested ranges, what is the realistic distribution of annualized yields they should expect?

The distribution of outcomes across expiry levels reveals a clear structural pattern: the 7-day and 14-day tenors show the widest downside tails, with outliers reaching -10% of annualized yields, and the lowest medians of any expiry level, confirming that very short-dated options are structurally disadvantaged on BTC regardless of which delta or regime filter combination is used.
From 21 days onward the picture improves materially across the board. Medians turn clearly positive, worst-case outcomes become substantially less severe, and the bulk of combinations cluster above the zero line. There is meaningful variation within this group, as the 60-day tenor shows a notably compressed distribution suggesting it may occupy an awkward middle ground, while the 90-day tenor produces the widest upside range with outliers reaching +10%. However, the more important finding is that all four tenors in this range consistently outperform their shorter-dated counterparts on both median yield and downside protection.
The practical implication is that the productive expiry range begins at approximately 21 days, and that within this range the choice of specific tenor is a secondary consideration relative to the more consequential decision of delta selection examined in the preceding section.
These results, however, hold the rest of the implementation fixed in deliberately simple ways.
The strategy sells the same delta in every market environment and treats the volatility surface as a single number when in practice the shape of the surface and the intensity of the market regime carry their own information. Active managers who condition strike selection on call-wing richness, or who scale position size with how strongly the trend signal is firing, can extract meaningfully more premium than this framework captures. We do not pursue these refinements here, but they represent the natural next dimensions of the problem.

The mechanism behind this result is specific to BTC's volatility profile. Short-dated options, particularly 7-day and 14-day structures, are highly sensitive to intraday price moves. BTC's intraday volatility is substantial enough that weekly options frequently experience delta expansion within the holding period from short-term price spikes that then reverse, triggering stop-loss exits before the position has time to benefit from theta decay. The premium collected on a weekly option has simply not been large enough to absorb the stop-loss events that BTC's intraday behavior generates at any meaningful delta level.
The Institutional Sweet Spot
Synthesizing across the delta and expiry dimensions, a clear region of the parameter space has emerged as consistently dominant. Deltas lower than 25, paired with expiries of 21 days or longer, with the regime filter active, produce the strongest and most consistent results across the full study period.
Within this corridor, the data shows 100% positive outcomes at delta levels up to 0.20 and meaningful improvement in consistency at all expiry levels above 14 days. The boundary conditions are equally clear in the other direction: no configuration at 30-delta or above appears reliably in the top performers by blended Sharpe, and 7-day and 14-day expiries consistently underperform regardless of which delta or filter combination accompanies them.
The regime filter is the connective thread across this entire region. Among the top 100 combinations by annualized yield, 62% have the filter active versus only 38% in the bottom 100. This gap holds consistently across different cutoff thresholds, confirming that the filter's advantage is concentrated in genuinely well-configured strategies rather than distributed uniformly across the parameter space.
One important caveat applies to all of the findings above: the grid analysis evaluates each parameter combination over a single fixed period (October 01, 2021 through April 30, 2026) which includes a specific and unrepeatable sequence of bull markets, bear markets, and sideways regimes.
A strategy that performs well over this particular window may owe part of its success to the specific order in which those regimes arrived rather than to any structural advantage in the parameters themselves.
The natural question is whether the sweet spot identified here holds up regardless of when an investor started implementing it. In other words, whether the results are genuinely robust or merely well-timed. The next section addresses this directly by testing every configuration in the productive parameter region across every possible entry point in the dataset.
Robustness Across Entry and Exit Points: The Rolling Window Evidence
Institutional allocators rightly wonder at this point: does this work regardless of when I start?
A parameter grid simulated over a single fixed period, however long, cannot answer the question. A strategy that looks compelling over October 2021 to April 2026 might owe much of its performance to the specific combination of entry and exit points that happened to occur in that window.
This section evaluates the consistently of these results by testing them against every possible entry point in the data, including the worst ones.
The Rolling Window Evidence
We tested all combinations of delta levels (10-, 15-, 20-, and 25-delta) and expiries (30, 60, and 90 days) established as the productive corridor in the previous section across every possible 1-year and 3-year rolling window in the dataset, for a total of over 37,000 individual backtests.
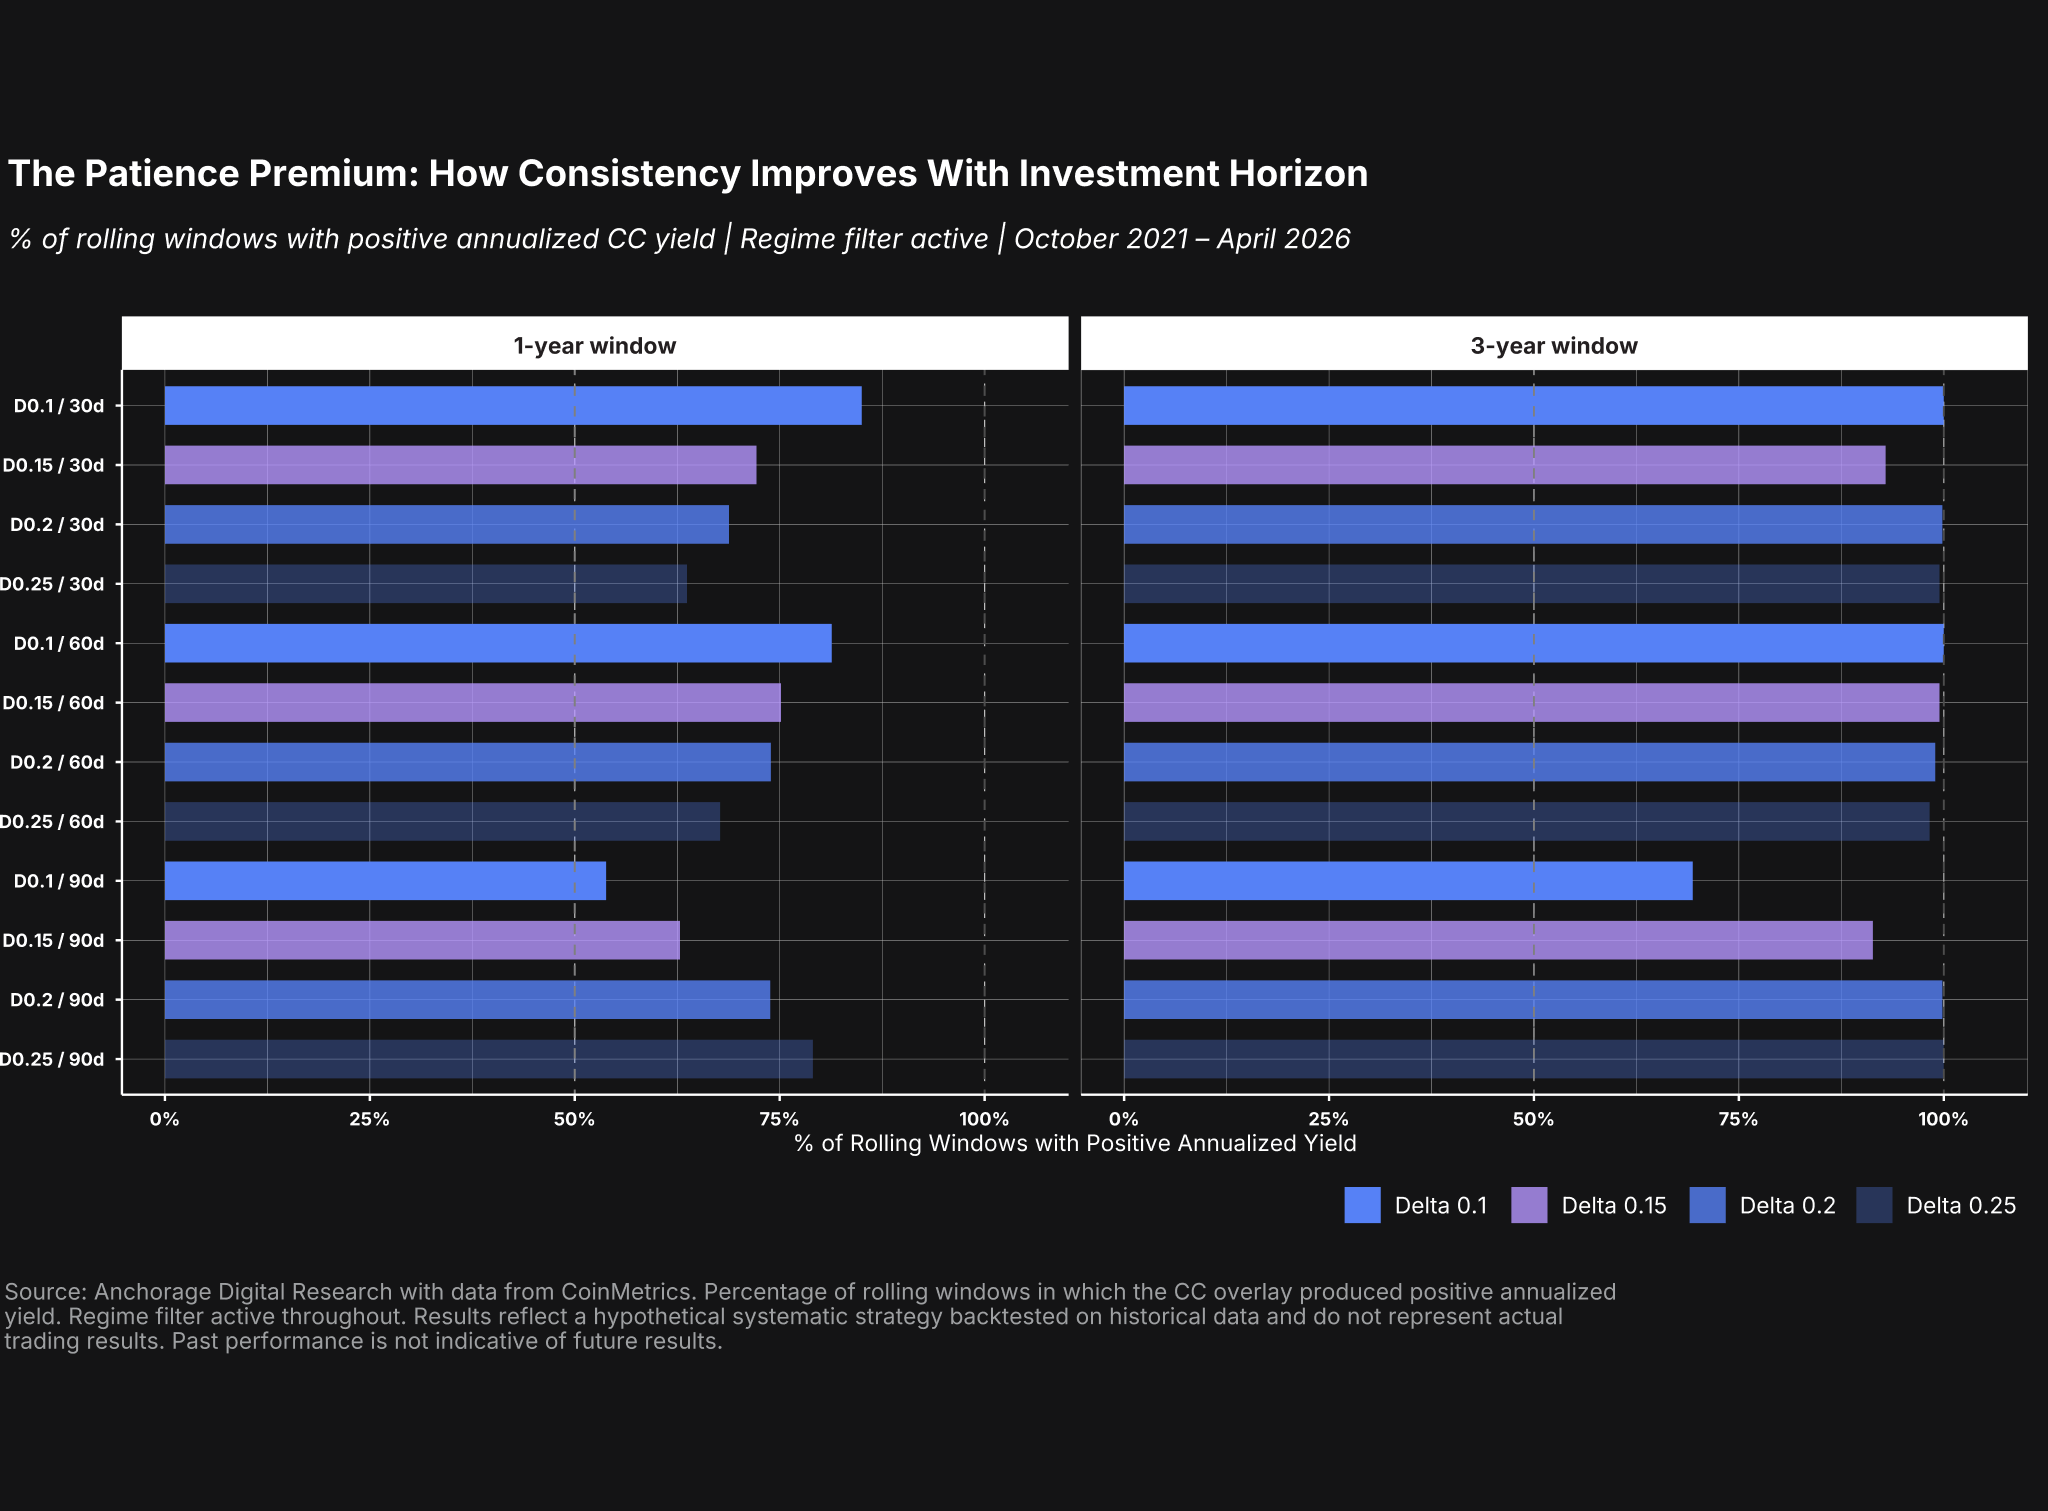
The results are striking. Across eleven out of the twelve delta-expiry combinations at the 3-year horizon, the covered call overlay produced positive annualized yield in 90% or more of all rolling windows. In nine of the twelve configurations, that success rate exceeded 95%.
Whether a BTC holder started implementing the overlay at the peak of the 2021 bull market, at the depths of the 2022 bear, or at any point in between, the strategy consistently generated a positive net annualized yield over any 3-year period for nearly every configuration tested. The only combinations that fall meaningfully short are in the extremes of the delta/expiry space, most notably 10-delta/90-day DTE.
The contrast with the 1-year results is equally instructive. At a 1-year horizon, positive yield rates range from approximately 50% to 85% across configurations. These have been meaningful but far from certain rates, and highly sensitive to which market regime the window happened to capture.
We call this discrepancy between one and three year rolling window results the patience premium, which reflects the excess return that the long-term investor can collect from more short-term oriented investors.
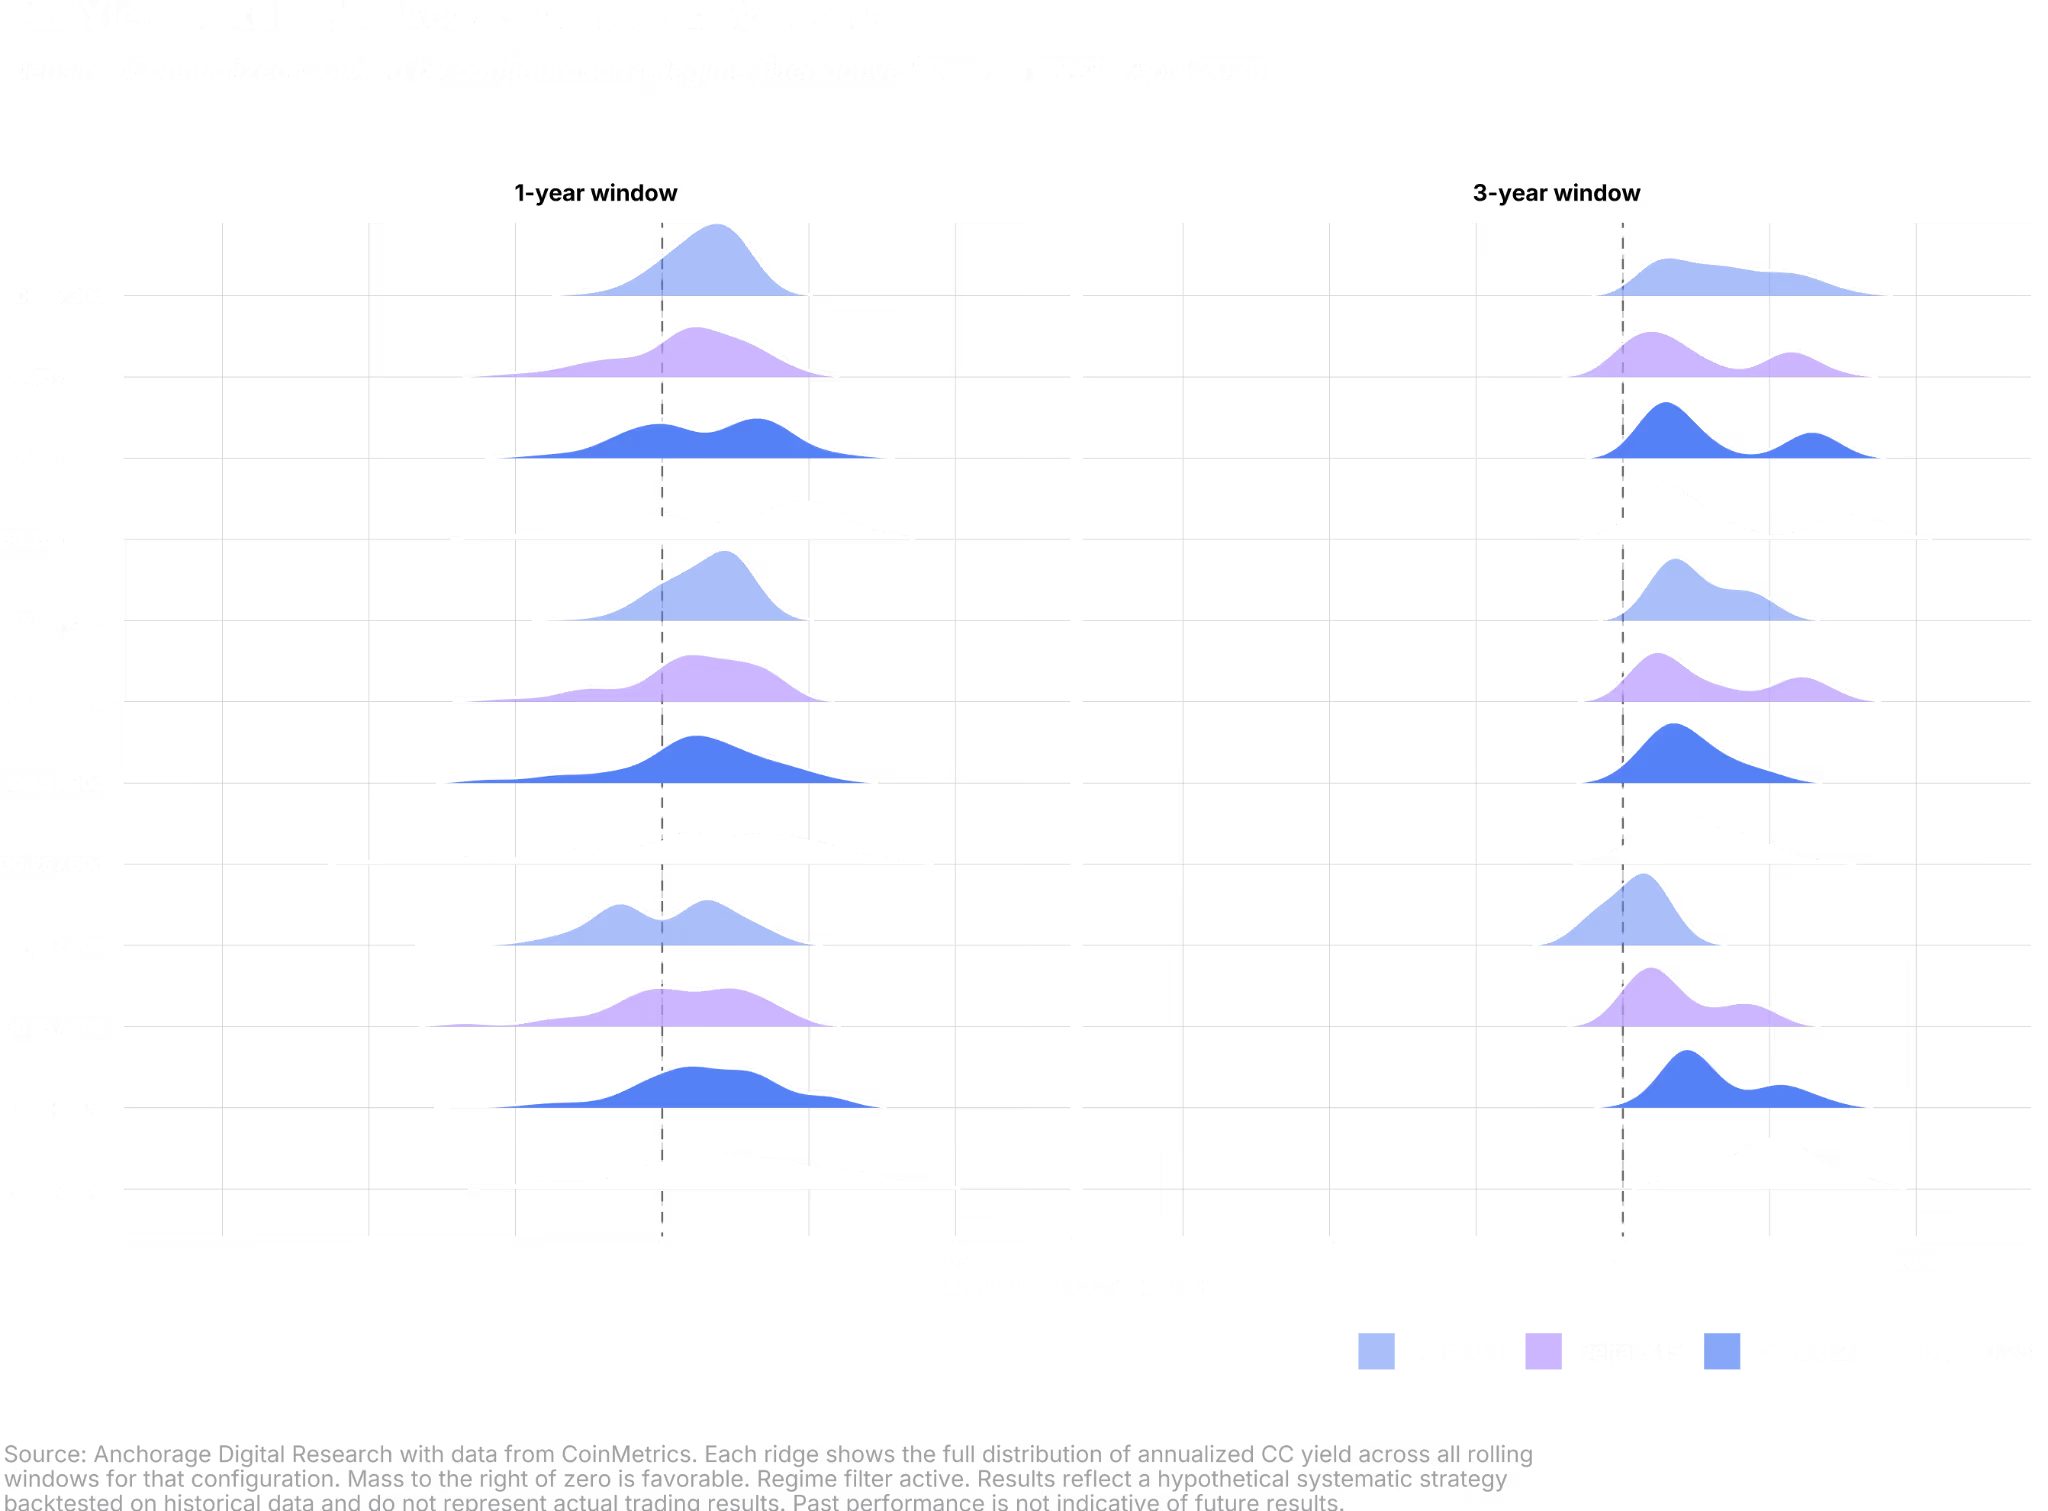
This is highlighted in the jump from the left of the right panel in the chart below.
It adds the magnitude of the contribution to the frequency. Each ridge shows the complete distribution of annualized covered call yield across all rolling windows for a given configuration. Mass concentration to the right of zero is favorable, a tight ridge indicates consistency, and a wide spread indicates sensitivity to market regime. The left panel shows 1-year windows, the right panel shows 3-year windows.

At the 1-year horizon, most configurations show bimodal distributions that straddle the zero line. The spread between those two modes is wide, in some configurations spanning 20 percentage points or more of annualized yield. This is the statistical signature of a strategy that is not yet diversified across market regimes. A single year is simply not enough time for the premium collection process to average out the noise introduced by BTC's episodic bull and bear cycles.
By the 3-year horizon, those two modes merge into a single distribution centered clearly in positive territory for nearly every configuration. The left tails contract, the peaks shift rightward, and the overall shape becomes tighter and more symmetric.
The D0.1/90d ridge represents a meaningful exception. Its widest left tail represents the relatively high prevalence of negative outcomes and reflects the opportunity cost problem of thin premium collected infrequently.
The table quantifies what the charts show visually.

At the 1-year horizon, mean yields across all twelve configurations are universally positive, ranging from roughly +0.2% to +4.6% annualized. While the magnitudes are modest, the universally positive average across every configuration is itself a meaningful consistency signal. The % Positive column tells the more important story. Even the strongest 1-year configurations reach only 85% success rates, with most clustering between 65% and 80%, meaning roughly one in four to one in five annual periods produced a loss.
The 3-year results represent a fundamentally different proposition. Median yields can more than double across most configurations, with the majority clustering between +4% and +6% annualized and the strongest configurations reaching double-digit territory in the top decile of 3-year windows. The % Positive column shifts dramatically: eleven of twelve configurations reach 91% or above, and five reach 100%, in terms of positive outcomes. The P10 column, the worst-decile outcome, turns positive for every configuration except for the 10-delta/90 DTE, which is the lone case where thin premium collected infrequently fails to overcome the regime sensitivity that even a 3-year horizon doesn't fully diversify away.
Conclusion: A Practical Framework for Institutional Implementation
This paper set out to answer a deceptively simple question: Can a systematic covered call overlay on an existing BTC position generate reliable yield across different market environments, and if so, under what conditions?
The historical evidence across tens of thousands of individual backtests indicates that the answer to this question has been affirmative, but if implemented with the discipline that the strategy's risk profile demands.
The foundational simulations tell a coherent story. An unfiltered strategy that generates an attractive yield of 5.5% annualized over the most recent twelve months, a favorable condition for this strategy, fails to capture that yield reliably over a full BTC cycle, producing a net negative result. The strategy's short volatility exposure becomes a source of concentrated losses precisely when BTC's episodic bull markets are at their most violent. Basic regime and implied volatility filters reverse that outcome entirely, turning a negative annualized drag into a meaningful +5.2% annualized yield over the same period by keeping the strategy on the sidelines roughly 56% of the time.
The parameter analysis and rolling window evidence together establish the structural boundaries of the opportunity.
Delta is the single most consequential choice: below 10-delta yields are too thin, above 25-delta directional exposure overwhelms the strategy. Therefore, the productive region sits between these extremes paired with expiries of 21 days or longer. Across every possible 3-year starting point in the dataset, eleven of twelve configurations in this productive corridor generated positive annualized yield in 91% or more of all rolling windows, with five reaching 100%. Median yields cluster between 4% and 6% across the productive corridor and reach into double digits in the strongest configurations.
Under our simulation assumptions, three distinct implementation profiles emerge from the data, each corresponding to a different investor objective.
A consistency-oriented mandate has been best served by lower deltas in the 10–15 range paired with shorter-to-mid expiries of 30–60 days, the corner of the parameter space where the worst-decile 3-year outcome remained positive across nearly every configuration. A balanced yield mandate has been best served by mid-range deltas of 15–20 paired with 30-day expiries, which combine near-universal positive 3-year outcomes with median yields meaningfully above the conservative corner and align with the most liquid point on the volatility surface. A yield-maximization mandate has been best served by higher deltas in the 20–25 range paired with longer expiries of 60–90 days, where median 3-year yields reach the high end of the entire grid at the cost of wider single-window dispersion.
Across all three profiles, two conditions hold without exception.
First, some form of market regime filter must be active. BTC's history shows that the strategy is otherwise overrun by the asset's large episodic bull runs, the pennies-in-front-of-a-steamroller trap that the paper has emphasized throughout. BTC's relatively well-established momentum frameworks have been favorable for identifying these regimes with a meaningful degree of success, but the specific filter design is secondary to the discipline of having some filter at all.
Second, the implementation horizon must be measured in years rather than months. The patience premium in BTC covered call selling is substantial and quantifiable: at the 1-year horizon, positive yield rates across the productive parameter corridor range from roughly 55% to 85%, reflecting genuine regime sensitivity. At the 3-year horizon, eleven of twelve configurations reach 91% or higher, with five at 100%. An investor evaluating this strategy over a single year is running a regime bet alongside a yield strategy. An investor with a 3-year mandate is running a yield strategy with a historically consistent probability of success.
Above all, covered call writing on BTC is an active management strategy, not a passive income overlay that can run on autopilot. The role of the professional volatility manager is to navigate the wide design space the strategy offers, optimizing within their mandate for the best risk-adjusted outcomes available at any given moment.
The results presented here, therefore, should not be read as prescriptive. They are a performance floor that shows what a disciplined but unsophisticated systematic implementation can achieve rather than a ceiling on what is possible. In practice, investors have access to a much richer opportunity set: conditioning entries on term structure dynamics, skew signals, market flow data, and real-time positioning analysis, none of which this paper has explored. Active position sizing, which we held constant throughout, is another dimension that can materially improve entry timing across BTC's full range of market environments.
Natural extensions of this work include applying the framework to crypto assets beyond BTC, where staking yield and other native return mechanisms change the economics of the covered call trade, and to BTC-adjacent instruments such as IBIT and BTC-augmentation proxies such as MSTR. Both IBIT and MSTR options have shown persistently higher call premiums than the Deribit market analyzed here. However, both also introduce constraints the Deribit-based strategy avoids: limited trading hours, exposure to overnight price gaps, and the more complex risk management they require. Each of these adjacent markets has its own steamrollers and its own pennies. Identifying both, in each, is the work we look forward to exploring in subsequent work.
A further extension, less methodological than structural, stems from the fact that the volatility risk premium documented here exists in a market that is rapidly institutionalizing. The natural test of whether the fat premium is a longstanding feature or a transitional one is time itself. We expect to revisit these results periodically, both to extend the sample and to test whether the gap versus traditional asset classes persists, compresses, or evolves as the supply side of BTC optionality matures.
Appendix I: Methodology
This report extends a line of research exploring the role of Bitcoin (BTC) and crypto assets in diversified portfolios. More specifically, it builds on the framework first published by David Lawant and Matt Hougan in May 2020 and most recently updated in February 2026 that focused on performance consistency over different rolling windows and allocation factors. Where that work focused on the spot allocation question, this paper examines the most widely implemented options strategy across the institutional crypto investor base: covered call selling as a systematic yield overlay on an existing BTC position.
Data
The analysis focuses exclusively on BTC, which represents over 60% of total crypto market capitalization (excluding stablecoins) and has the most active and longest-tenured options market in the asset class. While the BTC options landscape now includes Deribit (spot underlying), CME (futures underlying), and IBIT options (ETF underlying), and other venues, this study draws exclusively from Deribit data, which provides the longest continuous implied volatility surface history available and remains a deep venue globally for BTC options trading.
The study period runs from October 01, 2021 through April 30, 2026. This start date reflects the data availability of our data providers but also reflects the period in which we believe this market was efficient enough to be analyzed in an institutional setting. Spot price data comes from the Coinbase BTC/USD pair sourced by CoinMetrics at hourly frequency. Implied volatility surface data is also sourced from CoinMetrics and comprises hourly constant-delta implied volatility surfaces from Deribit across nine delta levels (5-delta through 45-delta) and six tenor pillars (7, 14, 21, 30, 60, and 90 calendar days to expiration).
Option Pricing and Volatility Surface Construction
All option premiums are computed using the Black-76 model. This is the standard framework for Deribit's coin-margined BTC contracts. The risk-free rate (r) is set to zero throughout for simplicity. With r equal to zero, the forward price equals spot, which means the model ignores the BTC basis and funding rates embedded in futures markets. We believe this approximation is immaterial at the 7-to-30-day tenors but could introduce modest imprecision at the 60-day and 90-day tenors tested in this analysis.
Implied volatility inputs are obtained by linear interpolation between the two nearest tenor pillars at each hourly observation. Entry strikes are solved analytically from the target delta using the inverse of the Black-76 delta formula. To simulate realistic execution, a symmetric volatility slippage adjustment is applied: the strategy sells at mid minus a slippage parameter of one volatility point and buys back at mid plus the same parameter, avoiding the common backtesting error of assuming mid-market execution on both legs.
Simulation Design
Execution logic for entries, exits, delta monitoring, and mark-to-market valuation run at hourly granularity. Using more coarse data would miss intraday stop-loss breaches and understate gamma risk near expiry. However, all portfolio performance metrics (Sharpe, Sortino, and maximum drawdown, etc.) are computed on daily-aggregated returns, using end-of-day portfolio values. This produces statistics more directly comparable to regularly published research.
Portfolio returns are expressed as simple returns on initial capital. Spot returns, covered call overlay returns, and blended portfolio returns all share the initial BTC spot price as the denominator.
For covered call yields, we adopt the initial-capital (or fixed-denominator) convention. This differs from time-weighted return (TWR), which uses a floating denominator that grows with the position, and from money-weighted return (MWR/IRR), which incorporates the timing of capital flows. The choice of denominator matters when the underlying moves substantially over the simulation window.
We adopt this convention here for two reasons. First, it makes the covered call overlay yield directly additive to the BTC spot return. For example, a +5% overlay yield plus a −20% spot return produces a −15% blended return on a like-for-like basis. Second, it represents the realistic accounting of an investor who deploys a fixed amount of capital in BTC at inception and tracks dollar-denominated PnL against that initial outlay.
Readers comparing these figures to TWR-reported strategy returns elsewhere in the literature should expect modest differences in the same direction as the underlying's return: when BTC has appreciated over the window, initial-capital yields read higher than the equivalent TWR figures; when BTC has fallen, they read lower.
When active, the regime filter requires BTC's 10-day simple moving average (SMA) to sit below its 30-day SMA and the 30-day SMA to sit below the 50-day SMA as a way to avoid markets that become exponentially bullish. The IV richness filter requires the current 30-day implied volatility at the strategy delta to exceed its trailing 90-day rolling average, computed within each backtest window to avoid lookahead bias.
The strategy re-enters immediately after each exit when conditions are met, with no cooling-off period between trades.
Appendix II: Academic Foundations of Covered Call Writing
The academic literature on covered call writing spans more than two decades and reaches a broadly consistent conclusion: the strategy improves risk-adjusted returns in most market environments, but extracts a meaningful cost in sustained bull markets investors can frequently underestimate.
The foundational empirical work was done by Whaley (2002), who used the (then newly published) CBOE S&P 500 BuyWrite Index (BXM), which backfilled returns to 1988, to show that a systematic at-the-money covered call strategy earned nearly the same return as the S&P 500 from 1988 to 2001, with substantially lower volatility and superior Sharpe and Sortino ratios. Feldman and Roy (2005) and Callan Associates (2006) extended this work over longer periods and additional benchmarks, reaching similar conclusions and helping establish covered call writing as an institutionally credible yield overlay strategy.
The most rigorous decomposition of why the strategy works comes from Israelov and Nielsen at AQR, across two influential papers published in the Financial Analysts Journal (2014, 2015). Their key insight is that a covered call embeds three distinct risk exposures: long equity, short volatility, and an unintended short equity-reversal bet. The short volatility component (the actual mechanism behind premium income) has historically generated a Sharpe ratio close to 1.0 in isolation, validating the volatility risk premium as a genuine and persistent source of return. However, that component contributes less than 10% of the strategy's total risk. The equity reversal exposure, by contrast, contributes roughly 25% of risk but generates little compensating return. Their conclusion is not that covered calls are bad, but that the standard implementation is inefficient and that investors are taking on uncompensated risks alongside the genuine premium they are trying to harvest.
The most substantive criticisms of the strategy center on two related problems. The first is opportunity cost in bull markets. Particularly through the large-cap technology-driven rally of the post-pandemic era, the BXM has meaningfully trailed a simple long equity position. The capped upside, which is a theoretical cost in all environments, becomes the dominant effect when markets trend strongly upward. The second, more pointed critique comes from Israelov and Nze Ndong (2023), who found that high-yield covered call implementations (those designed to maximize premium income) actually lost money on a round-trip basis over the full period studied, and that the higher the yield target, the worse the losses. This is because aggressively selling calls introduces deep negative skewness: The strategy caps the right tail of the return distribution while leaving the left tail largely intact, an asymmetry that risk-averse investors should find unappealing.
Taken together, the literature suggests that the relevant question is not whether covered call selling generates a real premium, but whether a given implementation captures that premium efficiently and deploys it in the right conditions.
The two main failure modes are well-identified: selling calls indiscriminately through strong uptrends, and selling so aggressively that the negative skewness overwhelms the premium collected.
The conditional strategy examined in this paper is designed with both failure modes explicitly in mind. Whether these conditions are sufficient in the specific context of BTC, an asset with structurally higher implied volatility and a more pronounced volatility risk premium than any traditional equity index, is the central empirical question this paper addresses.
1 Whaley, Robert E. "Return and Risk of CBOE Buy-Write Monthly Index." The Journal of Derivatives, Vol. 10, No. 2 (Winter 2002): 35–42. Available at: https://www.pm-research.com/content/iijderiv/10/2/35
2 Feldman, Barry E., and Dhruv Roy. "Passive Options-Based Investment Strategies: The Case of the CBOE S&P 500 BuyWrite Index." The Journal of Investing, Vol. 14, No. 2 (Summer 2005): 66–83. Available at: https://joi.pm-research.com/content/14/2/66
3 Callan Associates. "An Historical Evaluation of the CBOE S&P 500 BuyWrite Index Strategy." October 2006. Available at: https://cdn.cboe.com/resources/education/research_publications/Callan_CBOE.pdf
4 Israelov, Roni, and Lars N. Nielsen. "Covered Call Strategies: One Fact and Eight Myths." Financial Analysts Journal, Vol. 70, No. 6 (November/December 2014): 23–31. Available at: https://www.aqr.com/Insights/Research/Journal-Article/Covered-Call-Strategies-One-Fact-and-Eight-Myths
5 Israelov, Roni, and Lars N. Nielsen. "Covered Calls Uncovered." Financial Analysts Journal, Vol. 71, No. 6 (November/December 2015): 44–57. SSRN: https://ssrn.com/abstract=2444999. AQR working paper version: https://www.aqr.com/-/media/AQR/Documents/Insights/Journal-Article/Covered-Calls-Uncovered.pdf
6 Israelov, Roni, and David Nze Ndong. "A Devil's Bargain: When Generating Income Undermines Investment Returns." Working paper, October 26, 2023. SSRN: https://papers.ssrn.com/sol3/papers.cfm?abstract_id=4580048. Subsequently published in The Journal of Alternative Investments.
About Anchorage Digital
Custody, settlement, staking, and governance services are offered through Anchorage Digital Bank National Association (“Anchorage Digital Bank”). Digital asset trading services are provided by Anchorage Hold LLC (“Anchorage Hold”). Agency trading services are offered in New York by Anchorage Digital NY, LLC. BitLicense #0000041. A1 Ltd. is a principal trading business. Anchorage Services, LLC (“Anchorage Services”) is an NFA-registered introducing broker, NFA ID No. 0532710. Anchorage Digital Bank, Anchorage Hold, and Anchorage Services are not registered with the SEC or any state authority as a broker or dealer and are not authorized to engage in the business of the offer, sale, or trading of securities. Anchorage Digital services are offered to institutions and certain high net worth individuals in limited circumstances. Certain trading services are designed and available only for institutions who meet eligibility requirements, including qualification as an Eligible Contract Participant (ECP) under the rules of the U.S. Commodity Futures Trading Commission. For institutions participating in custody, staking, or governance with Anchorage’s Singapore entity, those services are offered through Anchorage Digital Singapore Pte Ltd (“Anchorage Digital Singapore”). Anchorage Digital does not provide legal, tax, or investment advice or private banking services. There can be no assurance that any cryptocurrency, token, coin, or other crypto asset will be viable, liquid, or solvent. No Anchorage Digital communication is intended to imply that any digital asset services are low-risk or risk-free. Digital assets held in custody are not guaranteed by Anchorage Digital and are not subject to the insurance protections of the Federal Deposit Insurance Corporation (FDIC) or the Securities Investor Protection Corporation (SIPC).
For institutions participating in custody, staking, or governance with Anchorage’s Singapore entity, those services are offered through Anchorage Digital Singapore Pte Ltd (“Anchorage Digital Singapore”), a major payments institution licensed by the Monetary Authority of Singapore.
Digital assets held in custody are not guaranteed by Anchorage Digital and are not subject to the insurance protections of the Singapore Deposit Insurance Corporation (“SDIC”). Anchorage Digital Singapore is not a member of the Singapore Deposit Insurance (“DI”) Scheme and assets are not subject to the protections enjoyed by depositors with DI Scheme member institutions.
Anchorage Digital Bank National Association offers fiat custody services through the use of an FDIC-insured, licensed sub-custodian.
This Stablecoin Rewards Program (the "Program") is offered by an entity separate from Anchorage Digital Bank, N.A. Stablecoins must be held with custody or wallet platforms offered by Anchorage Digital Bank National Association, Anchorage Digital Singapore Pte, Ltd., or Anchorage Innovations, LLC, in order to be eligible for rewards. This program is not offered by any of the aforementioned custody or wallet service providers. Please refer to the Stablecoin Rewards Program Terms & Conditions for all applicable terms and risks. By participating in the Program, participants acknowledge that they have read, understood, and agreed to be bound by this disclaimer and any other terms and conditions governing the Program. Information in this document is for general educational purposes only and eligibility limitations apply. This document is not intended to constitute an offer, solicitation, recommendation, investment, or any other advice on financial products. Availability is subject to jurisdictional limitations.
The Program is not subject to regulatory oversight in any jurisdiction. Participants in the Program acknowledge and understand that the Program is not regulated by any governmental authority. As such, there are no guarantees regarding the stability, security, or reliability of the Program. Participation in the Program carries inherent risks, including but not limited to the risk of loss of funds, lack of recourse in case of disputes, and potential volatility of a stablecoin's value. Participants are responsible for understanding and complying with all applicable laws, regulations, and requirements in their respective jurisdictions regarding the use, possession, and transfer of digital assets, including stablecoins. Nothing in the Program constitutes investment advice, financial advice, or any other form of professional advice. Participants should conduct their own research and seek appropriate professional advice before participating in the Program. Anchorage Digital Neo, Ltd. and its affiliates, officers, directors, employees, agents, and representatives shall not be liable for any losses, damages, liabilities, costs, or expenses arising out of or related to participation in the Program, regardless of the cause of action or legal theory asserted.
“Anchorage Digital Prime" is a trade name for a suite of digital asset products and services. It does not refer to any one specific legal entity. All services are provided by one or more of the specific Anchorage Digital entities. Custody, settlement, staking, and governance services are offered through Anchorage Digital Bank National Association (“Anchorage Digital Bank”). services are provided by Anchorage Hold LLC (“Anchorage Hold”). Agency trading services are offered in New York by Anchorage Digital NY, LLC. BitLicense #0000041. A1 Ltd. is a principal trading business. Anchorage Services, LLC (“Anchorage Services”) is an NFA-registered introducing broker, NFA ID No. 0532710. Anchorage Digital Bank, Anchorage Hold, and Anchorage Services are not registered with the SEC or any state authority as a broker or dealer and are not authorized to engage in the business of the offer, sale, or trading of securities. Anchorage Digital services are offered to institutions and certain high net worth individuals in limited circumstances. Certain trading services are designed and available only for institutions who meet eligibility requirements, including qualification as an Eligible Contract Participant (ECP) under the rules of the U.S. Commodity Futures Trading Commission. For institutions participating in custody, staking, or governance with Anchorage’s Singapore entity, those services are offered through Anchorage Digital Singapore Pte Ltd (“Anchorage Digital Singapore”). Anchorage Digital does not provide legal, tax, or investment advice or private banking services.
Find additional legal and compliance information at anchorage.com/legal.
This post is intended for informational purposes only. It is not to be construed as and does not constitute an offer to sell or a solicitation of an offer to purchase any securities in Anchor Labs, Inc., or any of its subsidiaries, and should not be relied upon to make any investment decisions. Furthermore, nothing within this announcement is intended to provide tax, legal, or investment advice and its contents should not be construed as a recommendation to buy, sell, or hold any security or digital asset or to engage in any transaction therein.
Anchorage Digital Bank National Association offers fiat custody services through the use of an FDIC-insured, licensed sub-custodian.
